0
Football Match Report
split_2022-09-17-SV_Waldhof_Mannheim018_saicain.json (30.09.2024)
Video length : 90 min 0 sec
1
Summary
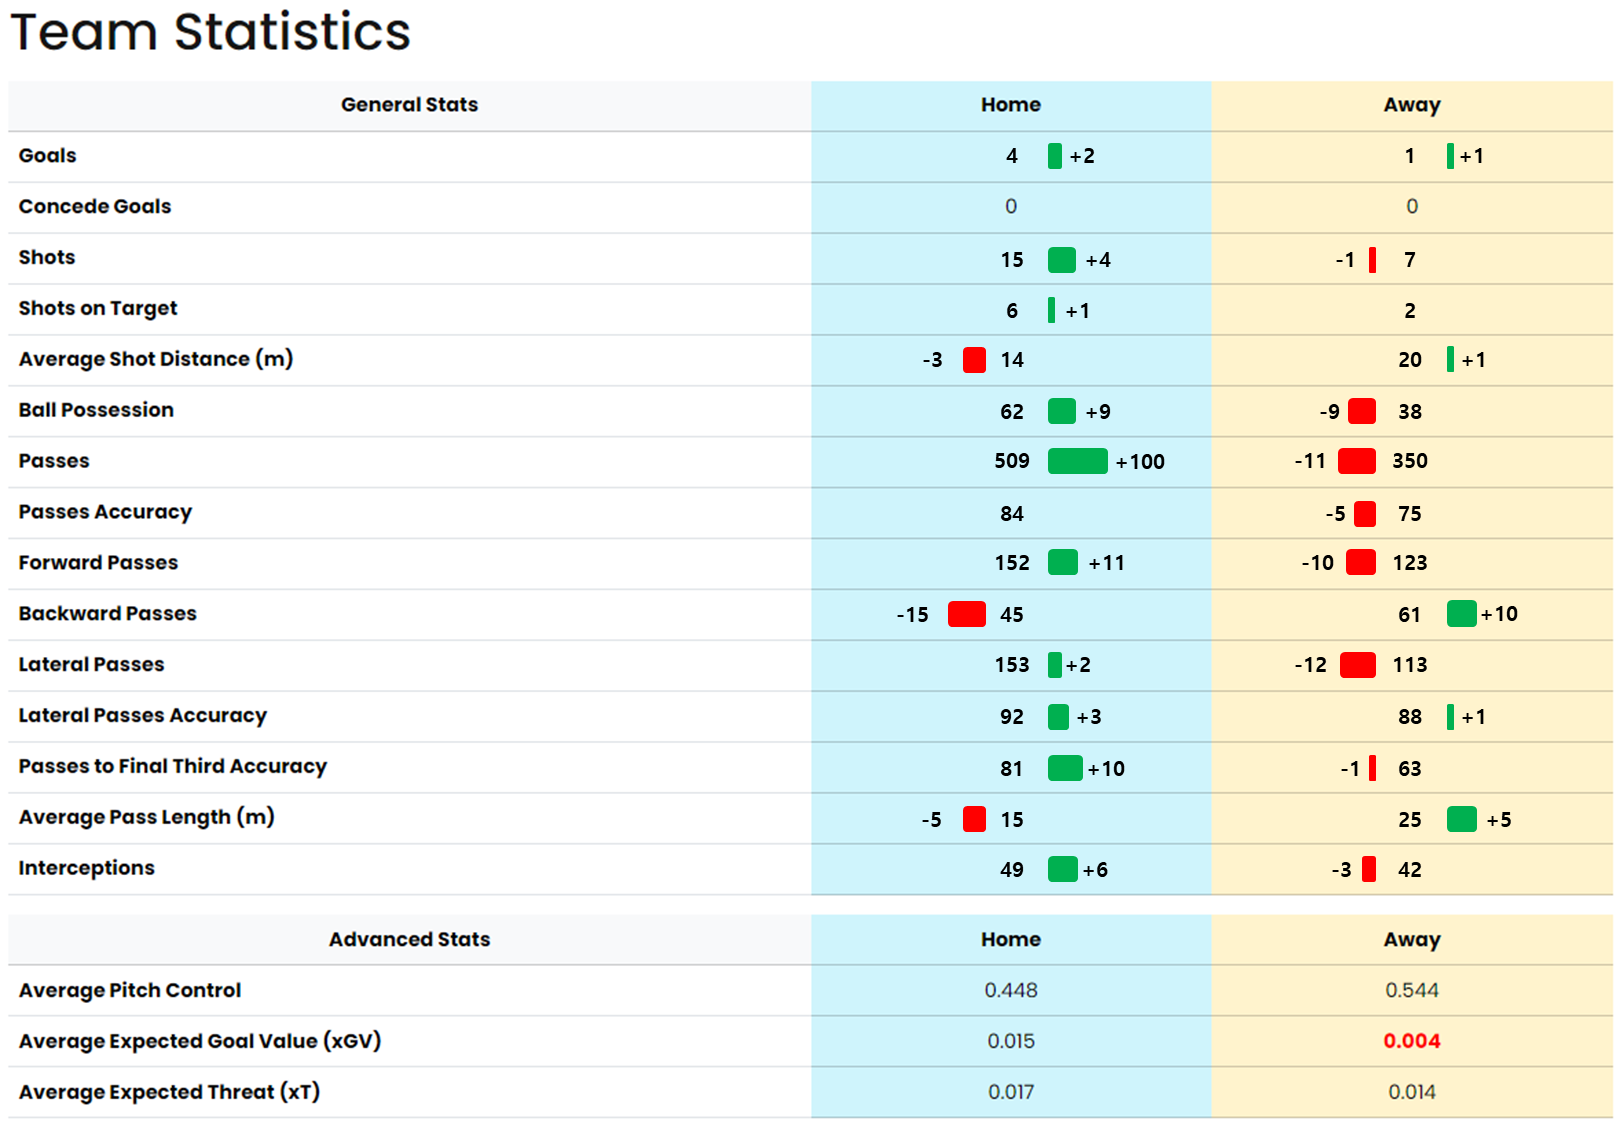
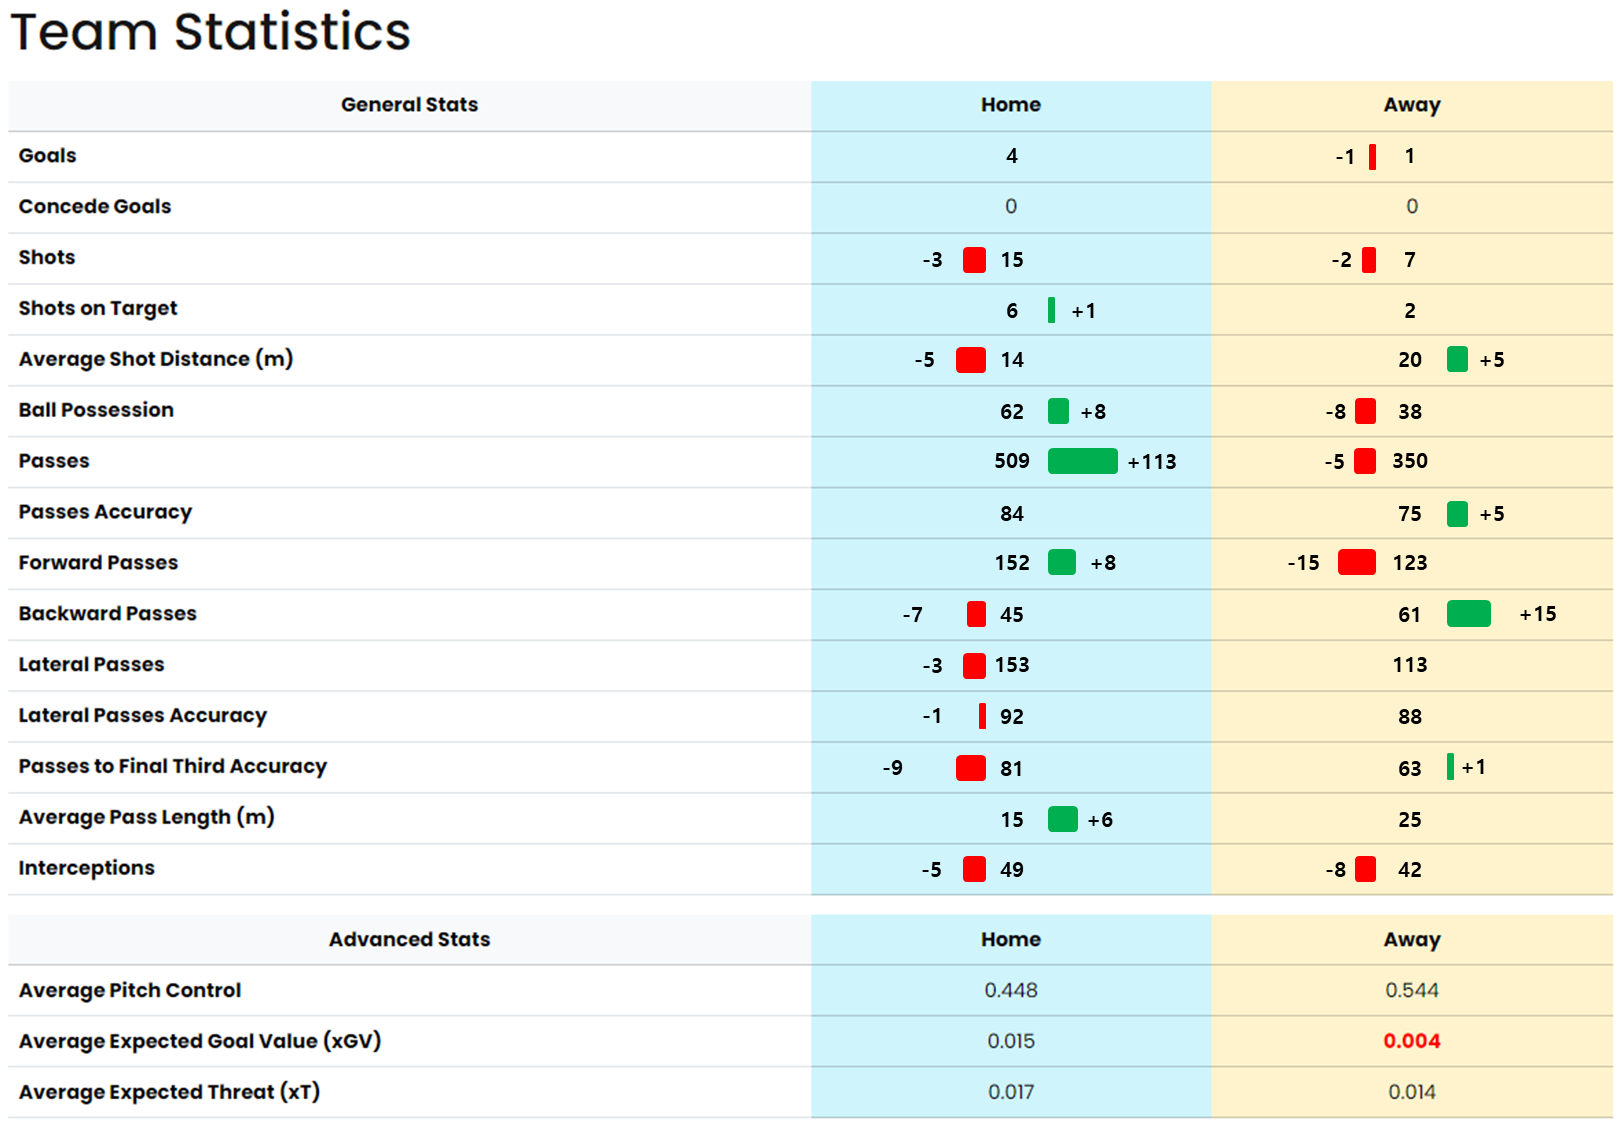
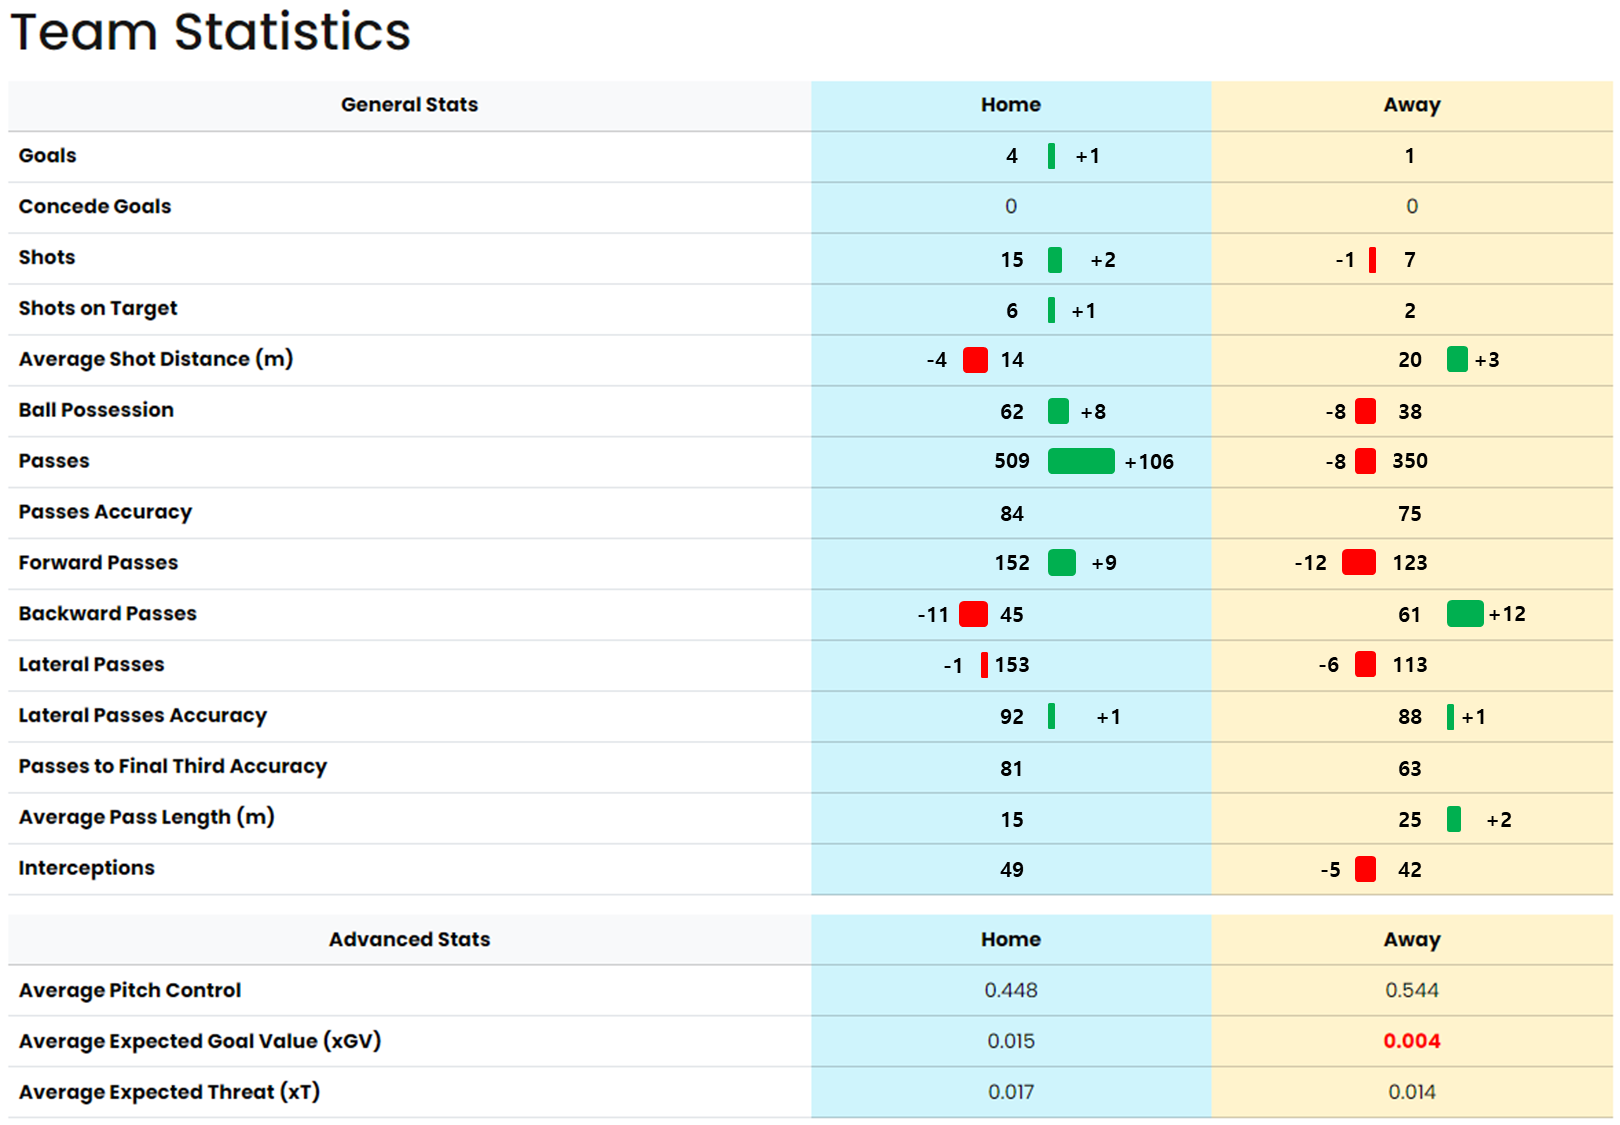
- The home team had a higher ball possession percentage (61.15%) compared to the away team (38.85%), indicating that they dominated the game in terms of having control over the ball.
- The away team was more accurate with their passes, with an accuracy rate of 67.69% compared to the home team's 52.69%, suggesting that they were more effective in completing their intended passes.
- The away team had a higher number of shots and shots on target than the home team, indicating that they created more scoring opportunities during the game.
- The home team had a significantly lower average shot distance compared to the away team (13.8 vs 18.3), which may indicate that the away team was shooting from further out and relying less on close-range shots.

|
|---|

|
|---|

|
|---|

|
|---|

|
|---|
Match Dynamics
| Total | 1st half | 2nd half | |
|---|---|---|---|
| ● Home | 0.612 | 0.673 | 0.571 |
| ● Away | 0.388 | 0.327 | 0.429 |
Pitch Control Dynamics
| Total | 1st half | 2nd half | |
|---|---|---|---|
| ● Home | 0.029 | 0.037 | 0.024 |
| ● Away | 0.009 | 0.008 | 0.011 |
xGV Dynamics
| Total | 1st half | 2nd half | |
|---|---|---|---|
| ● Home | 0.051 | 0.059 | 0.046 |
| ● Away | 0.022 | 0.017 | 0.025 |
xT Dynamics
Action Map
Shot Map

● Home

● Away
Shot Zone

● Home

● Away
Conclusion
KPI Performance Report

SV Waldhof Mannheim
(02 October 2024, W12)
Team Performance Analysis (Past 12 Games)
| Match | Goals Scored | Shots on Target | Avg Shot Distance (yards) | Ball Possession (%) | Passes Accurate (%) | Interceptions | Penalties Converted | Set Pieces with Shots | Corners with Shots | Conceded Goals | Shots Against on Target | Losses | Fouls | API | CRI | FSI | SSS |
|---|---|---|---|---|---|---|---|---|---|---|---|---|---|---|---|---|---|
| Home Match 1 | 3 | 8 | 18.5 | 63 | 88 | 9 | 1 | 5 | 3 | 1 | 4 | 0 | 10 | 0.27 | 1 | 0.44 | 0.50 |
| Away Match 1 | 1 | 3 | 22.3 | 48 | 81 | 12 | 0 | 2 | 1 | 3 | 9 | 1 | 15 | -0.48 | 0 | 0.27 | 0.40 |
| Home Match 2 | 2 | 6 | 19.2 | 60 | 86 | 11 | 0 | 4 | 2 | 0 | 3 | 0 | 8 | 0.96 | 0 | 0.51 | 0.16 |
| Away Match 2 | 1 | 5 | 21.7 | 46 | 79 | 10 | 0 | 3 | 1 | 2 | 7 | 1 | 13 | -0.53 | -1 | 0.96 | 0.58 |
| Home Match 3 | 1 | 4 | 20.1 | 55 | 83 | 8 | 0 | 6 | 3 | 2 | 6 | 1 | 11 | 0.14 | 1 | 0.42 | 0.45 |
| Away Match 3 | 2 | 7 | 19.5 | 52 | 84 | 13 | 0 | 4 | 2 | 1 | 5 | 0 | 12 | -0.31 | 1 | 0.24 | 0.55 |
| Home Match 4 | 4 | 9 | 17.8 | 67 | 90 | 7 | 1 | 7 | 4 | 1 | 5 | 0 | 7 | -0.97 | 1 | 0.76 | 0.53 |
| Away Match 4 | 0 | 2 | 24.0 | 44 | 77 | 14 | 0 | 1 | 0 | 4 | 10 | 2 | 17 | -0.25 | 0 | 0.27 | 0.77 |
| Home Match 5 | 3 | 7 | 21.0 | 65 | 85 | 9 | 1 | 5 | 3 | 2 | 6 | 0 | 9 | 1.00 | 1 | 0.75 | 0.44 |
| Away Match 5 | 1 | 4 | 23.5 | 50 | 80 | 12 | 0 | 3 | 1 | 3 | 8 | 1 | 14 | -0.95 | -1 | 0.65 | 0.32 |
| Home Match 6 | 2 | 5 | 20.5 | 64 | 88 | 10 | 0 | 6 | 4 | 0 | 4 | 0 | 8 | 0.67 | 1 | 0.70 | 0.61 |
| Away Match 6 | 0 | 3 | 25.0 | 43 | 76 | 15 | 0 | 2 | 1 | 5 | 11 | 2 | 18 | -0.34 | 0 | 0.32 | 0.44 |

• Win, Draw, Lose source : https://www.ncbi.nlm.nih.gov/pmc/articles/PMC11204448
• Key Performance Indicators Predictive of Success in Soccer: A Comprehensive Analysis of the Greek Soccer League

Popup
